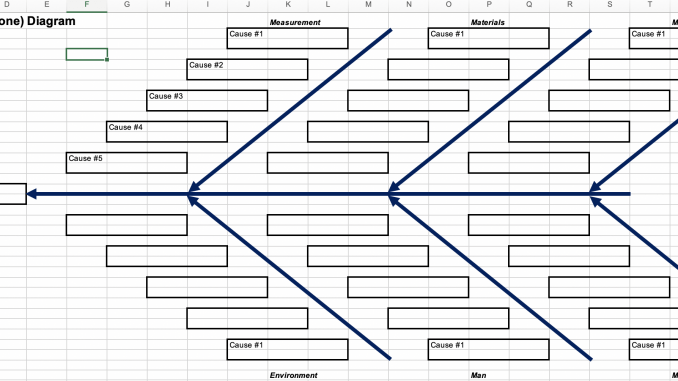
Fishbone Analysis for Excel
Any DMAIC Six Sigma Project must have a fishbone analysis completed in the Define phase. Originally called the Ishikawa diagram, the fishbone is an excellent team-building exercise to get other teams or departments to sit down and agree to the contributors (x\’s) to the problem or outcome at hand (y).
Once all identifiable causes are documented, consensus is obtained through the brainstorming process of eliminating or isolating the problem so that the true problem-solving exercise begins. After this, the Cause and Effect Matrix is completed, then the FMEA (Failure Mode Effects Analysis)


Be the first to comment