
The concept of random versus non-random is not a difficult one. A better approach might be to state that the difference between random versus non-random is not a difficult one (so the author claims). If we are armed with a realistic but simple illustration, the differences between random and non-random may seem a little more obvious.
Definition of Random
Let us first look at a definition of RANDOM:
- … lacking any definite plan or prearranged order (1)
- … occurring or done without definite aim, reason, or pattern (2)
When referring to randomness we can also state that each “thing” or “item” in the set of data has an equal chance at being selected; there are no favourites. This is a property that is key in statistical sampling. The properties of randomness must be obtained, as best as possible, in order to ensure unbiased results.
The Illustration – Part 1:
You will now be asked to examine a series of numbers, as shown below. The numbers range from 1 to 100, and no two entries are the same. They have been randomly entered into a 10-by-10 matrix.
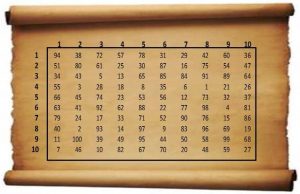
You are now challenged to look over the data for 30 seconds. At the end of the allotted time, try to recreate the above table on a blank sheet of paper, without looking at the matrix above. You may take up to 90 seconds to complete this step. It should become apparent, that unless you possess a photographic or eidetic memory, the task to recreate the above table accurately might be a challenge.
So, how well did you do? How many numbers did you remember? Score yourself one point for each number you correctly remembered (or even guessed at) by row and by column. TOTAL: .
The Setup – Part 1:
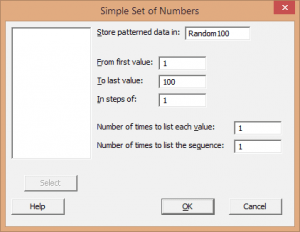
The numbers were generated using a statistical software program called Minitab 17® (3). The steps included the following:
Calc > Make Patterned Data > Simple Set of Numbers {to generate a simple set of one hundred numbers from 1 to 100}.
The resulting column of 100 observations were randomized using:
Calc > Random Data > Sample from Columns {referring back to the string already generated}.

The resulting string of 100 numbers was then formatted into a 10-by-10 matrix – as randomly as possible.
Note: some will argue that no series of random numbers are truly “random”, but that’s a whole other story.
Definition of Non-Random
Now, we will address the second part of this discussion – Non-Random. Trying to find an appropriate description led me to the synonym – BIAS:
- … tending to yield one outcome more frequently than others … (4)
- … having an expected [pattern] different from the quantity or estimate … (4)
The Illustration – Part 2:
You will now be asked to examine the series of numbers below. The numbers, again range from 1 to 100, and no two entries are the same. They have also been entered into a 10-by-10 matrix.
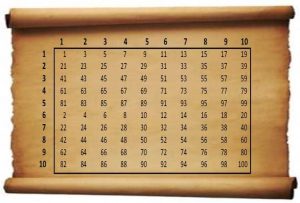
The first string of 50 observations was generated by listing the odd numbers from 1 to 99. The second string of 50 observations were generated by listing the even numbers from 2 to 100. The two strings were then formatted into the patterned 10-by-10 matrix above. That’s it!
The reader may have noticed that this time around, Minitab 17® (3) was used to generate only the 10-by-10 matrix with pre-planned pattern. The second step that was used to create the first 10-by-10 matrix {Calc > Random Data > Sample from Columns} was not used.
Summary:
Hopefully, the reader can see that with a simple illustration such as the one above, the concept of random versus non-random becomes a little clearer. The first set of 100 numbers represent the best possible picture of random data, in that there was no reference to “Patterned Data”. The second series of numbers were created using “Patterned Data”. Patterns in data and anywhere else are a result of non-randomness, otherwise known as bias.
References:
- Collins English Dictionary – Complete and Unabridged © HarperCollins Publishers 1991, 1994, 1998, 2000, 2003
- Random House Kernerman Webster\’s College Dictionary © 2010 K Dictionaries Ltd. Copyright 2005, 1997, 1991 by Random House, Inc. All rights reserved.
- Minitab®2.1
- merriam-webster.com/dictionary/biased


Be the first to comment