
Value Stream Map Excel Template — Complete VSM Toolkit
Original price was: $39.00.$29.00Current price is: $29.00.
Map your entire value stream in Excel — no drawing tools, no formula-building. This value stream map Excel template calculates takt time, draws your current-state map automatically, and reveals how little of your lead time actually adds value.
✔ 8 linked tabs + dashboard ✔ Self-drawing current-state map ✔ Takt, lead time & cycle efficiency ✔ Future-state planning ✔ Instant .xlsx download
Description
See your whole value stream — and the waste hiding in it — in minutes.
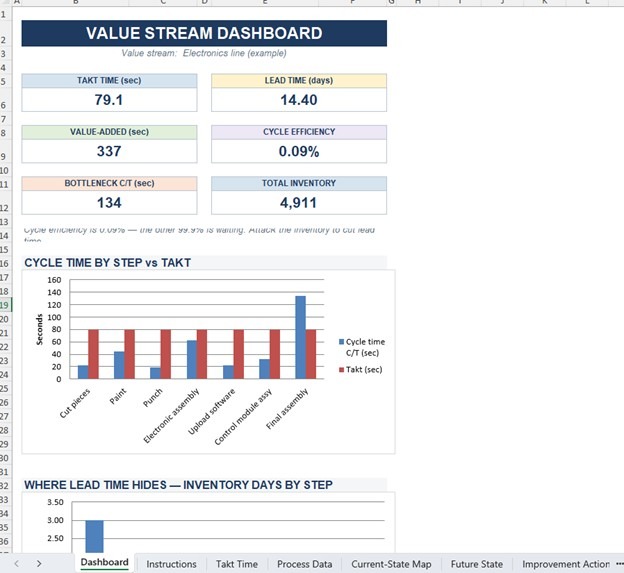
This value stream map Excel template turns a simple process table into a complete current-state analysis. Enter each step once, and the workbook calculates takt time, draws your value stream map, builds the lead-time ladder, and reports Process Cycle Efficiency — the single number that exposes how much of your lead time is waiting rather than adding value.
Why use this value stream map Excel template
Traditional value stream mapping means wrestling with drawing tools or rebuilding formulas every time. This lean VSM workbook does the maths for you and redraws the map straight from your data, so you spend your time removing waste instead of formatting boxes.
What the template calculates
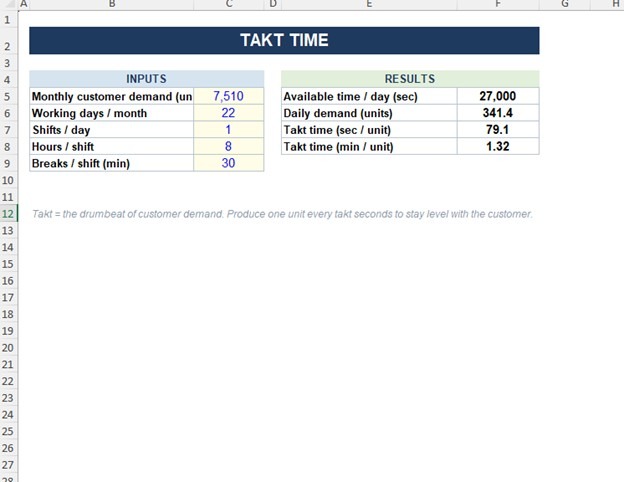
- Takt time from customer demand and your shift pattern — the pace you must produce to
- A self-drawing current-state map — process boxes, cycle time, changeover, uptime and inventory, live from your data
- The lead-time ladder — total lead time versus value-added time, the way Toyota’s production system intended
- Process Cycle Efficiency, so you can see the gap between value-added work and waiting inventory (WIP)
- Bottleneck detection — any step whose cycle time exceeds takt is flagged automatically
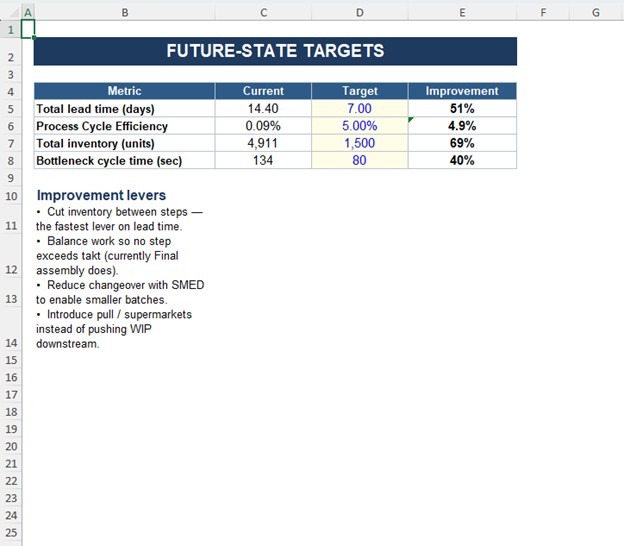
- Future-state targets — set target lead time and efficiency and the workbook shows the improvement gap
What’s inside (8 linked worksheets)
Dashboard, Takt Time, Process Data, Current-State Map, Future State, Improvement (kaizen) log, a VSM symbols reference, and step-by-step instructions.
Who it’s for
Lean practitioners, Six Sigma Green and Black Belts, continuous-improvement and operations teams running current-state and future-state mapping, kaizen events, or DMAIC projects — in manufacturing or any process with cycle time, inventory and flow.
What you get
Instant download of a single Microsoft Excel (.xlsx) file. Works in Excel 2016 and later, and Microsoft 365. Single-user license.
8. FAQ (add this as a Rank Math FAQ block — it generates FAQ schema and feeds Google’s NLP / AI Overviews with question-answer passages)
- Which Excel versions does it work in? Excel 2016, 2019, 2021 and Microsoft 365, on Windows and Mac.
- Does it work for office or service processes too? Yes — cycle time, wait time and inventory map to any process, not just manufacturing.
- What is Process Cycle Efficiency? Value-added time divided by total lead time; in most unimproved value streams it’s under 5%, and closing that gap is the goal.
- Can I plan a future state? Yes — the Future State tab lets you set target lead time and efficiency and shows the improvement gap.
- Do I get free updates? Yes, any updates to this version are included with your purchase.
Related products
-
Sale!

HACCP Compliance Toolkit — 50 Audit-Ready Checklists & Logs for Excel and Google Sheets
Original price was: $29.99.$14.99Current price is: $14.99. Add to cart -
Sale!
Pugh Matrix Template for Excel and Google Sheets — Complete 5-Workbook Suite
Original price was: $49.99.$19.99Current price is: $19.99. Add to cart -
Sale!

Attribute Sigma Calculator for Excel
Original price was: $12.00.$9.00Current price is: $9.00. Add to cart -
Sale!
FMEA Template for Excel (Failure Mode & Effects Analysis)
Original price was: $19.00.$15.00Current price is: $15.00. Add to cart