
Kaizen & Continuous Improvement Templates — 10 Excel Workbooks with Dashboards
Original price was: $49.99.$29.99Current price is: $29.99.
Ten Excel workbooks covering the whole continuous improvement cycle: planning and running a kaizen event, writing the A3, auditing 5S, walking for the eight wastes, calculating OEE, balancing standard work to takt, tracking PDCA, finding root cause with 5 Why and fishbone and 8D, running a suggestion scheme, and rolling it all up into a portfolio dashboard.
Every workbook has a live dashboard. No macros, no add-ins. Works in Excel, Google Sheets and LibreOffice.
Description
Kaizen continuous improvement templates that do the arithmetic for you
Most lean templates you can download are printable forms. A grid, some headings, a column for a tick and a column for comments. They are fine as a memory aid and useless as a tool, because the moment you want to know whether the area actually improved, you are back in a blank spreadsheet building the calculation yourself.
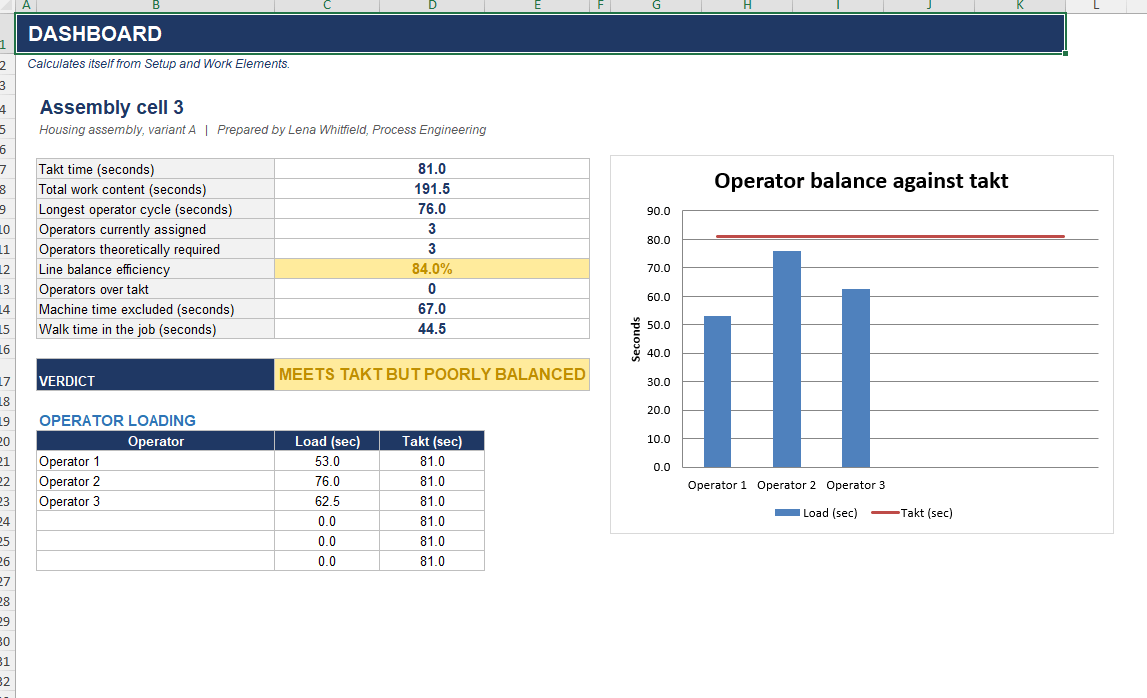
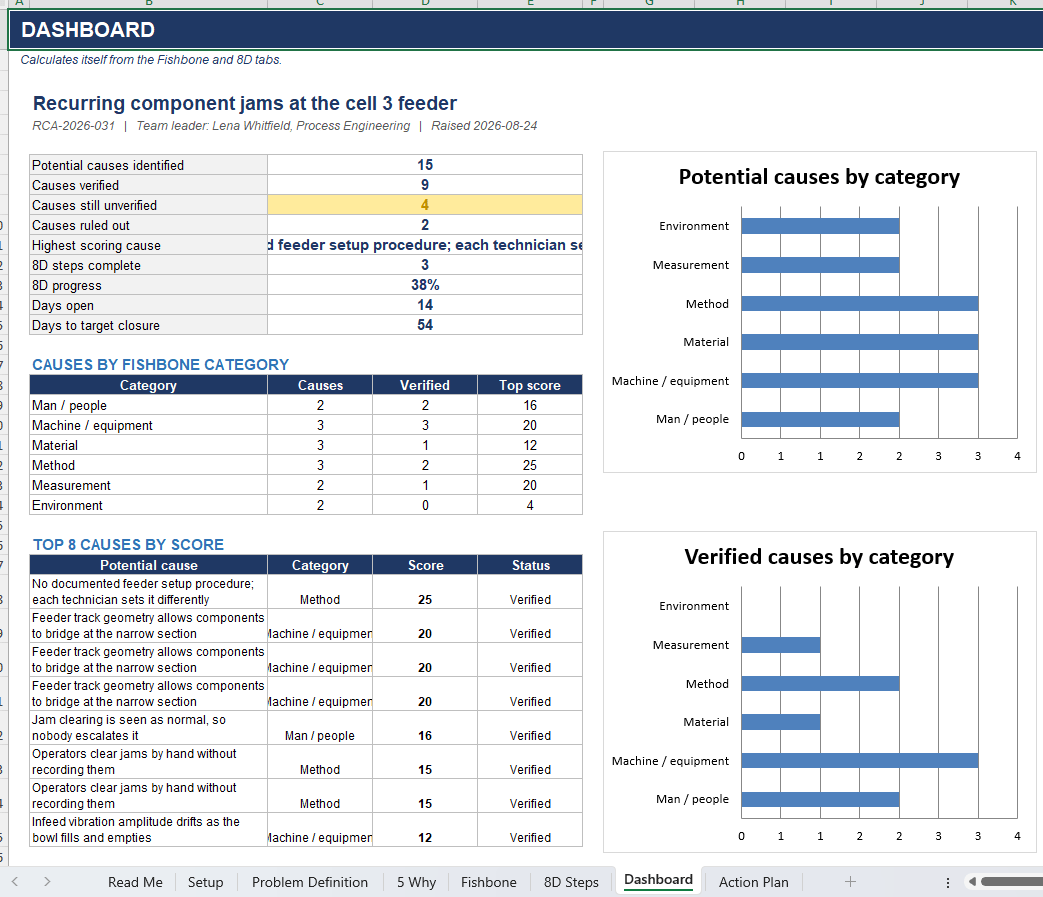
This bundle is ten workbooks that calculate. The 5S audit produces a weighted score and a pass or fail verdict. The waste walk log turns “we saw a lot of waste” into an annualised cost, ranked. The OEE workbook takes shift data and gives you availability, performance and quality separately, so you know which one is dragging. The takt time sheet tells you how many operators the job needs and which one is the bottleneck.
What is in the bundle
| # | Workbook | When you reach for it |
|---|---|---|
| 01 | Kaizen Event Planner & Checklist | Four weeks before an event, through to thirty days after |
| 02 | Kaizen Event Charter & A3 Report | Getting it approved, then reporting what it delivered |
| 03 | 5S Audit & Sustainment Scorecard | Monthly, per zone, with a trend across audits |
| 04 | Waste Walk — 8 Wastes Observation Log | On a gemba walk, classifying against DOWNTIME |
| 05 | OEE & Downtime Loss Analysis | When someone asks what the line’s OEE actually is |
| 06 | Standard Work & Takt Time Balance | Building or rebalancing a cell |
| 07 | PDCA Improvement Cycle Tracker | Continuously, across every improvement you have running |
| 08 | Root Cause Analysis — 5 Why, Fishbone & 8D | When a problem keeps coming back |
| 09 | Kaizen Idea & Suggestion Register | From the day the suggestion scheme launches |
| 10 | Continuous Improvement Portfolio Dashboard | Monthly, for the steering meeting |
Plus a Start Here guide with a suggested order if you are building a program from nothing.
The details that make them usable
N/A does not mean zero. Every scored workbook lets you mark a line N/A, and an N/A line is removed from both the score and the maximum rather than counted as a failure. That single behaviour is what lets you run the same 5S audit in a machine shop and a warehouse without the irrelevant lines dragging the result down.
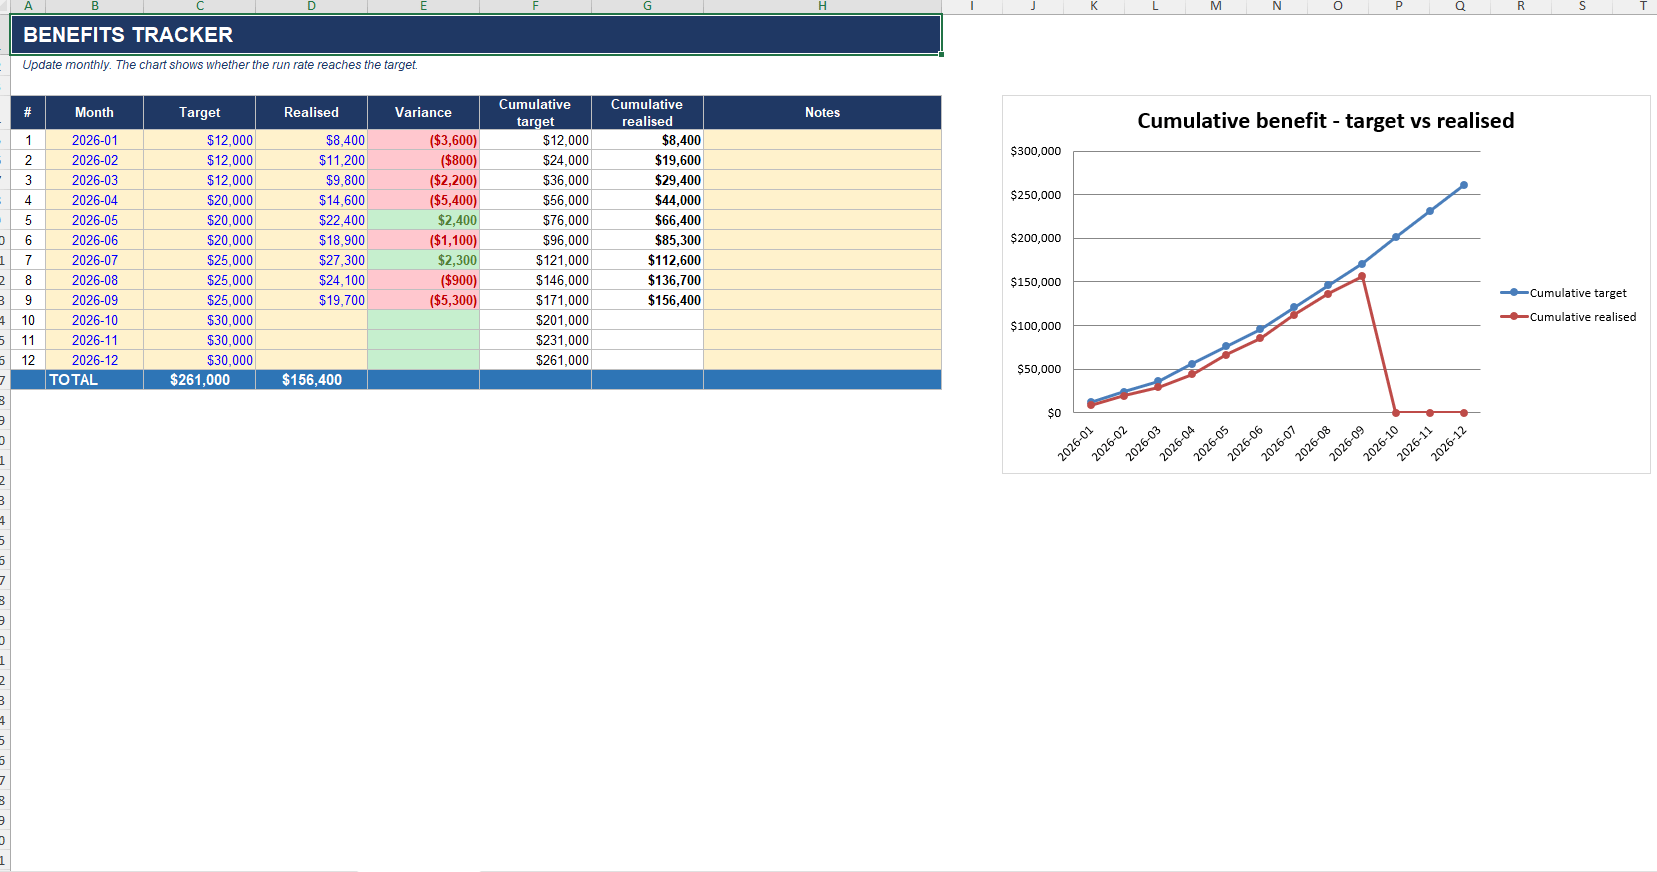
Forecast benefit and realised benefit are separate columns. The fastest way to lose credibility with a finance director is to report a forecast as a saving. The PDCA tracker and the portfolio dashboard keep the two apart and only let a figure move across when someone has verified it.
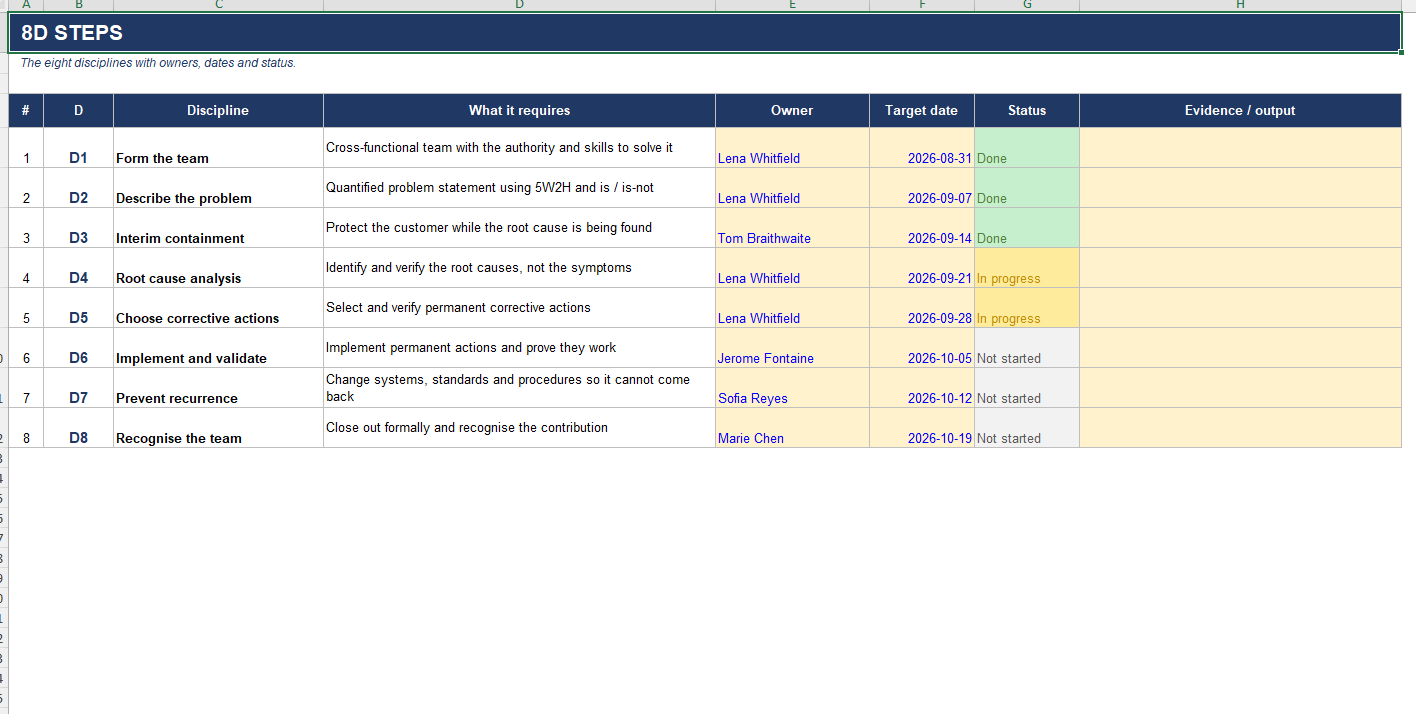
The 5 Why has a verification column. Most failed root cause analysis fails the same way: a plausible chain of whys, none of them tested, and a corrective action aimed at something that was never causing the problem. Marking each level Verified or Not verified makes the guesswork visible.
Machine time is excluded from operator loading. A common error in line balancing is adding machine time to the operator’s cycle. If the operator presses start and walks away, that time is not their work. Counting it makes an unbalanced line look balanced.
The kaizen event workbook has a thirty-day follow-up tab. Most events succeed for a fortnight and then quietly unravel. The difference is almost never the week itself, it is whether anyone owns the month afterwards.
Every workbook is built the same way
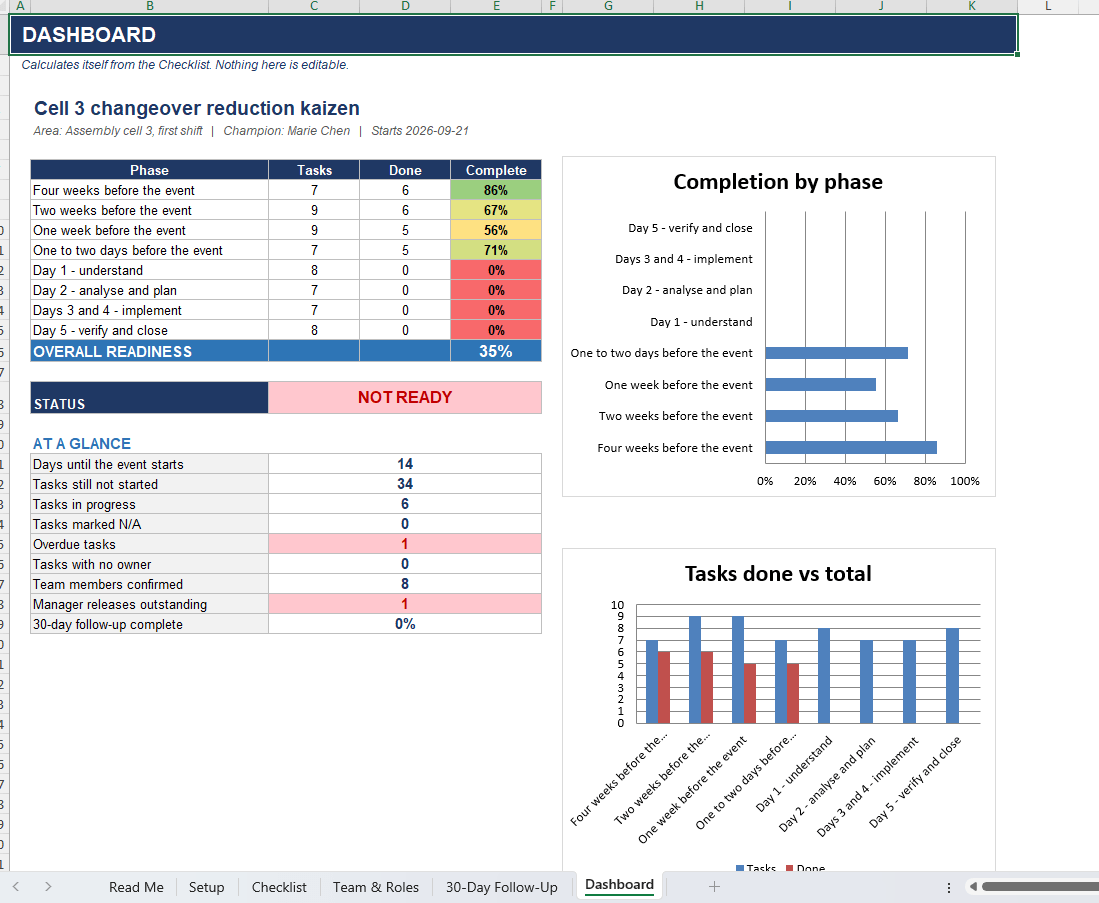
A Read Me that explains the tool and the theory behind the calculation. A Setup tab holding the handful of assumptions everything depends on. A working tab where you actually do the job. A dashboard that calculates itself, with a KPI strip, charts and a verdict where a verdict makes sense. An action plan with owners, priorities, due dates and an overdue counter.
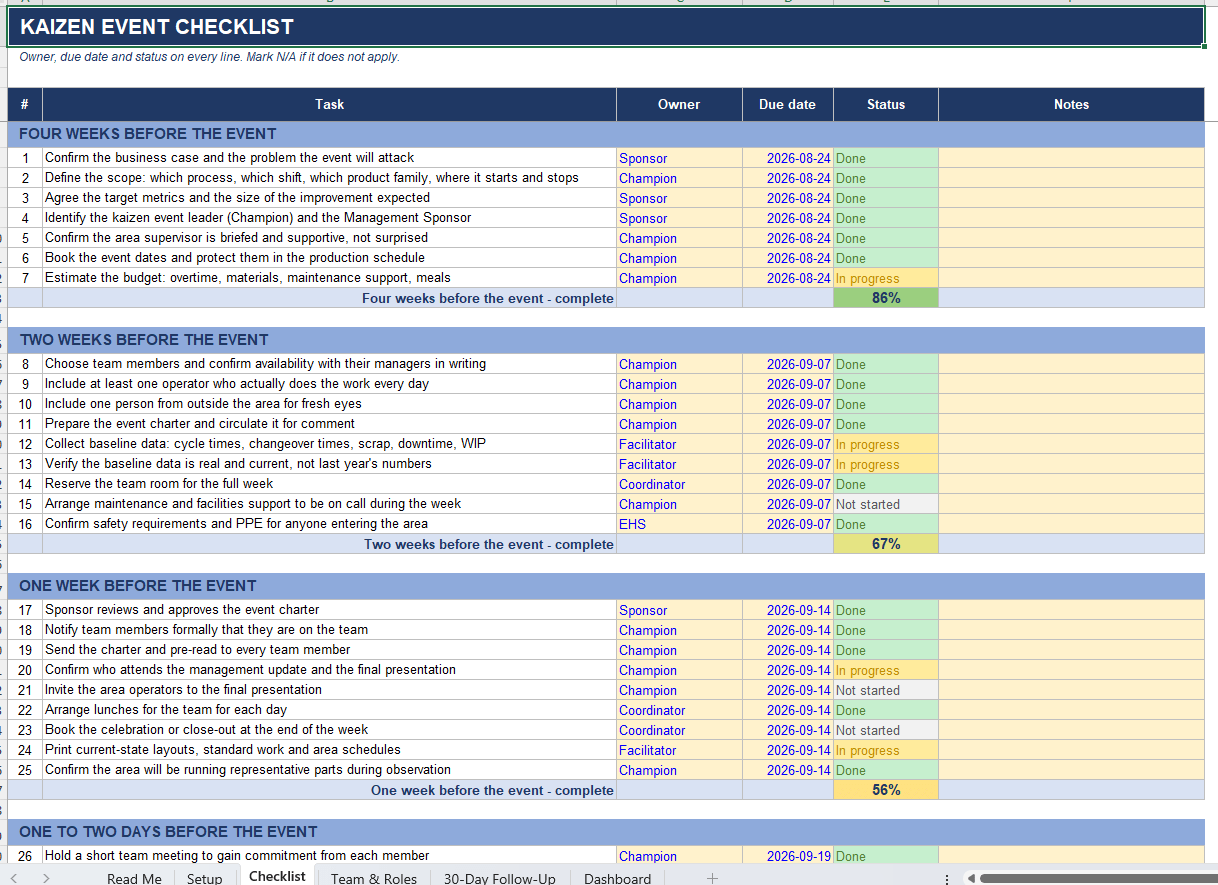
You only ever type in the yellow cells. Everything white is calculated.
What you get
- 11 Excel workbooks (.xlsx), 61 worksheets
- 23 charts and 78 conditional formatting rules already configured
- 45 dropdown lists so nothing is typed free-hand into a scored field
- Over 1,700 working formulas, every one of them recalculated and verified
- Realistic sample data in every file — one plant, one cast of people, one story running through all ten — so the dashboards work the moment you open them
- Instant download, unlocked and fully editable
Compatibility
Microsoft Excel 2010 and later, Excel for Microsoft 365, Excel for Mac, Google Sheets and LibreOffice Calc. No macros, no add-ins, no external links and no protected cells. Every formula is visible and every line can be edited, reworded or deleted.
Licence
Single-business commercial use. Use it on as many events, areas and audits as you like inside your own organisation. Redistribution and resale of the files are not permitted.
Related products
-
Sale!
Pugh Matrix Template for Excel and Google Sheets — Complete 5-Workbook Suite
Original price was: $49.99.$19.99Current price is: $19.99. Add to cart -
Sale!

Supplier Evaluation Scorecard Bundle — 10 Excel Templates with Dashboards
Original price was: $69.99.$39.99Current price is: $39.99. Add to cart -
Sale!
350 Project Management Templates Bundle — Mega Excel Templates Bundle with Visual Dashboards
Original price was: $49.99.$29.00Current price is: $29.00. Add to cart -
Sale!

HACCP Compliance Toolkit — 50 Audit-Ready Checklists & Logs for Excel and Google Sheets
Original price was: $29.99.$14.99Current price is: $14.99. Add to cart